1.1 SIGNIFICANT OPERATING INDICATORS FOR THE
POŠTA SLOVENIJE GROUP AND POŠTA SLOVENIJE D. O. O.
Key data in numbers
POŠTA SLOVENIJE GROUP
2020
2019
Index 2020/2019
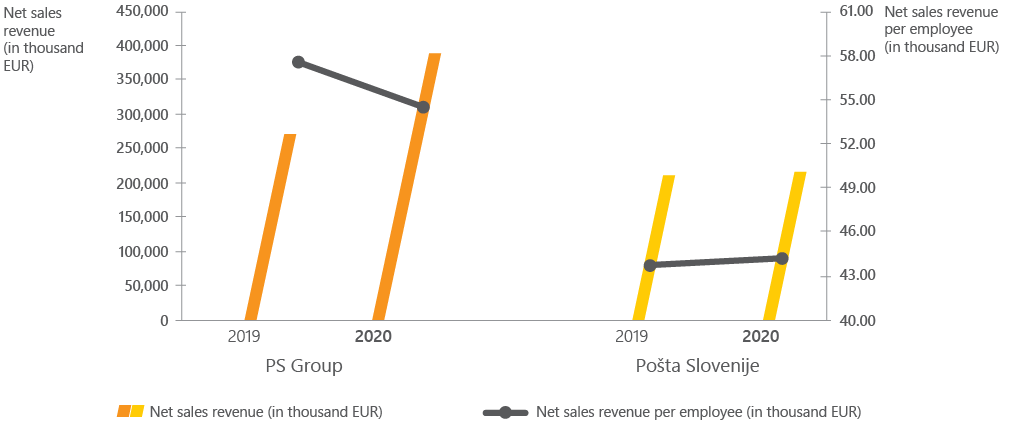
Net sales revenue (in EUR)
410,694,634
277,857,007
148
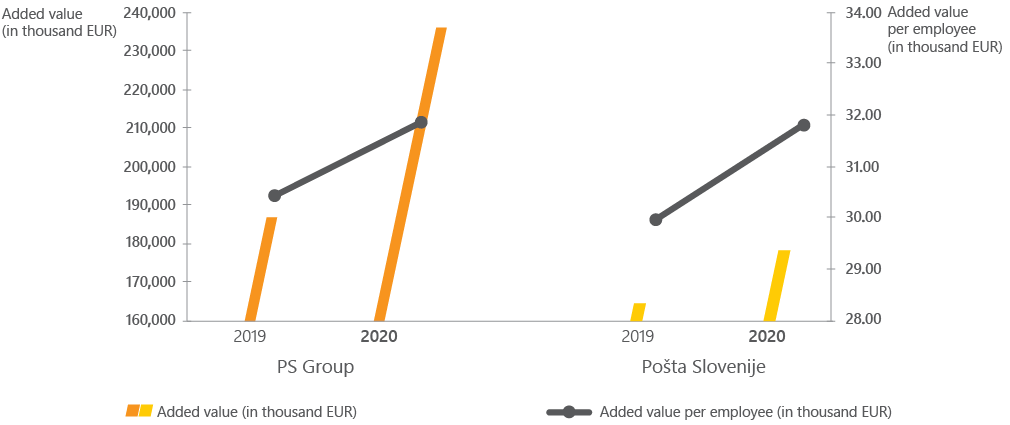
Added value (in EUR)
238,004,847
187,168,204
127
Gross cash flow (in EUR)
38,181,701
25,431,493
150
Operating profit (in EUR)
7,924,982
5,190,982
153
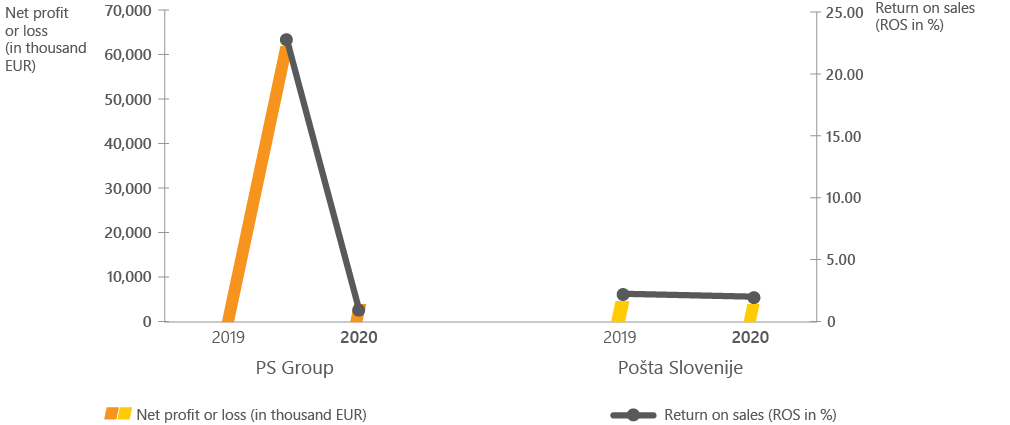
Net profit or loss of the Pošta Slovenije Group (in EUR)
5,175,054
65,267,063
8
Net profit or loss of the Pošta Slovenije Group (in EUR) – controlling interests
4,516,421
65,532,990
7
Value of investments (in EUR)
22,050,683
22,747,175
97
Average number of employees based on hours worked*
7,370
7,306
101
Added value per employee (EUR)**
32,292
30,822
105
Equity (in EUR)
325,473,155
329,639,462
99
Total assets (in EUR)
572,111,346
545,870,475
105
Equity ratio (in %)
56.9
60.4
EBITDA margin (in %)
8.9
9.0
Return on sales (ROS in %)
1.1
23.6
Return on equity (ROE in %)
1.4
26.6
Return on assets (ROA in %)
0.8
15.4
CAPEX (capital expenditure in %)
1.5
8.2
Key: ROS = net profit or loss / net sales revenue; ROE = net profit or loss / average balance of equity; ROA = net profit or loss / average balance of assets; CAPEX = value of investments / net sales revenue * Sum of no. of employees based on hours worked at the Pošta Slovenije Group, excluding Intereuropa and the Intereuropa Group ** (Added value of the Pošta Slovenije Group excluding Intereuropa + added value of the Intereuropa Group) / (average no. of employees of the Pošta Slovenije Group excluding Intereuropa + average no. of employees of the Intereuropa Group)
POŠTA SLOVENIJE
2020
2019
Index 2020/2019
Net sales revenue (in EUR)
240,603,293
236,015,959
102
Added value (in EUR)
175,386,162
163,152,298
107
Gross cash flow (in EUR)
21,036,628
20,573,006
102
Operating profit (in EUR)
130,439
3,794,739
3
Net profit or loss of Pošta Slovenije (in EUR)
3,130,312
4,157,023
75
Value of investments (in EUR)
18,116,665
19,823,115
91
Average number of employees based on hours worked
5,510
5,451
101
Added value per employee (in EUR)
31,828
29,932
106
Equity (in EUR)
218,677,483
216,528,576
101
Total assets (in EUR)
363,130,204
326,469,033
111
Equity ratio (in %)
60.2
66.3
EBITDA margin (in %)
8.4
8.7
Return on sales (ROS in %)
1.3
1.8
Return on equity (ROE in %)
1.4
1.9
Return on assets (ROA in %)
0.9
1.3
CAPEX (capital expenditure in %)
7.5
8.4
Key: ROS = net profit or loss / net sales revenue; ROE = net profit or loss / average balance of equity; ROA = net profit or loss / average balance of assets; CAPEX = value of investments / net sales revenue
Net sales revenue
Net profit or loss
Added value